8 AI-Driven Metrics Every Cricket Coach Must Track
By Sharat Chandra Kumar Manikonda
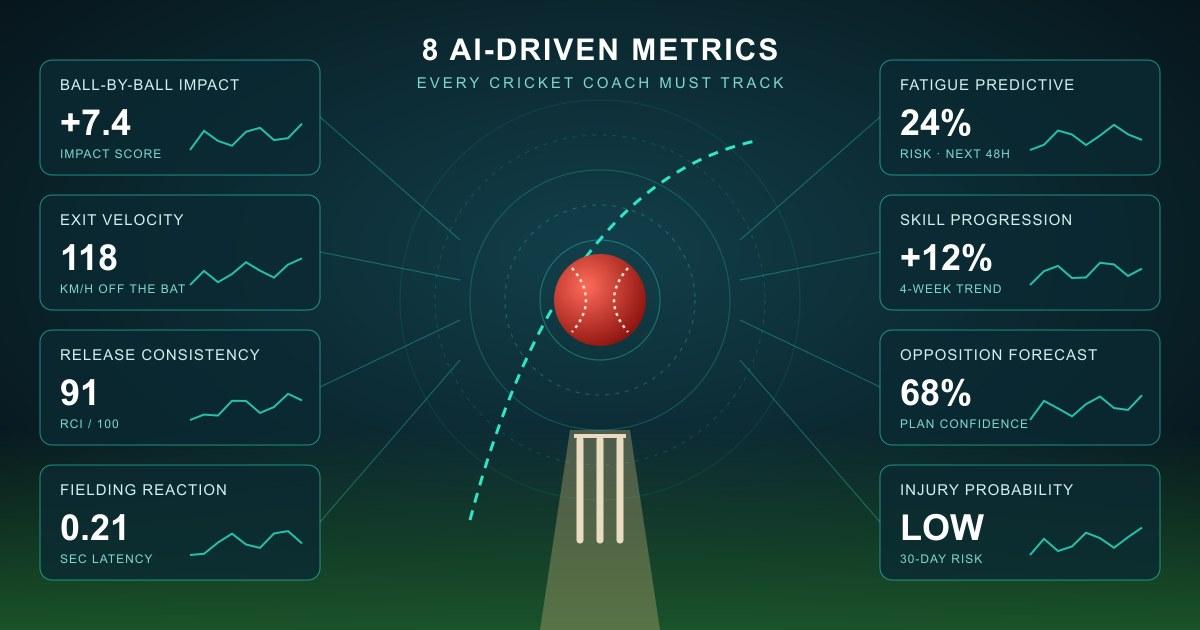
Cricket coaching is evolving from intuition-based decision-making to evidence-based performance engineering. By harnessing AI-powered coaching tools, you can quantify what once was only felt, predict outcomes before they happen, and tailor training with surgical precision. This guide reveals the eight most impactful AI-driven metrics, explains how they are generated, and shows you step-by-step how to turn raw data into actionable coaching plans that boost batting consistency, bowling accuracy, fielding sharpness, and injury resilience.
1. Ball-by-Ball Impact Score – Measuring Each Delivery’s Effect on Match Outcome
What it is
The Ball-by-Ball Impact Score aggregates contextual variables—run value, wicket probability, pitch condition, and game state—to assign a single impact rating (-10 to +10) to every delivery. AI in sports analytics parses historic ball-by-ball datasets (e.g., Cricsheet, ESPNcricinfo, CricViz) and uses machine-learning models to estimate how each ball shifts the win probability curve (Source: Twenty20 Win Probability Added).
Why it matters
- Highlights “high-leverage” overs where a bowler’s spell changed the match trajectory.
- Identifies batters who consistently produce high-impact shots even under pressure.
- Provides a common language for coaches, analysts, and players when reviewing video.
How AI generates it
- Feature extraction – AI extracts pitch map, speed, spin, seam position, and batter stance from video using computer vision.
- Contextual weighting – A gradient-boosted model incorporates match context (runs needed, wickets in hand, overs remaining).
- Outcome simulation – Monte-Carlo simulations predict win probability before and after the ball; the delta becomes the Impact Score.
Coaching actions
- Targeted session planning – Use the score to design “clutch” scenarios in net practice, replicating high-impact pressure situations.
- Bowling spell reviews – Spot bowlers whose impact scores dip after a certain number of overs and intervene with workload management.
- Batting mindset drills – Encourage batters to visualize the impact of each shot, reinforcing decision-making that maximizes win probability.
Tip: Pair the Impact Score with video clips in a dashboard to create a “highlight reel” that focuses on moments that truly mattered, not just boundaries or wickets.
2. Batting Exit Velocity & Angle – AI-Derived Power and Shot Selection Insights
What it is
Exit velocity measures the speed of the ball off the bat, while exit angle captures its trajectory. Ball-tracking systems (e.g., Hawk-Eye) and radar guns, combined with high-frame-rate cameras and AI models, compute these metrics for every shot, producing a shot-by-shot power profile.
Why it matters
- Differentiates genuine power hitters from those relying on timing alone.
- Reveals hidden weaknesses (e.g., low exit velocity on the pull shot) that can be exploited by opposition.
- Links shot mechanics to injury risk; excessive side-arm force can stress the elbow or shoulder.
How AI generates it
- Computer vision tracks bat-ball contact points in 3-D space.
- Physics-based modeling translates pixel displacement into speed and angle, calibrated by known reference shots.
- Machine-learning clustering groups shots into “power zones” (e.g., high-velocity straight drives vs. low-velocity sweeps).
Coaching actions
- Shot selection drills – Use the velocity-angle map to design drills that encourage high-impact zones (e.g., lofted straight drives over long-on).
- Technique refinement – Show batters a side-by-side comparison of optimal vs. sub-optimal swing paths, focusing on bat speed at the point of contact.
- Load management – Monitor cumulative high-velocity shots to avoid over-use of the forearm and reduce stress-fracture risk.
Related reading: Our guide to speed and agility training shows how AI turns physical-performance data into better training plans – see Cricket Speed & Agility Drills: How AI Turns Training Data Into Match-Winning Performance.
3. Bowling Release Consistency Index – Tracking Repeatability with Computer Vision
What it is
The Release Consistency Index (RCI) quantifies how tightly a bowler repeats key release parameters: seam position, wrist angle, shoulder rotation, and release point coordinates. Scores range from 0 (high variance) to 100 (near-perfect repeatability).
Why it matters
- Consistency drives accuracy; even a small deviation in release point can change line by several centimeters.
- Early detection of deteriorating mechanics can prevent injuries such as rotator-cuff strain.
- Provides a benchmark for comparing bowlers across formats (T20 vs. Test).
How AI generates it
- Pose estimation – Deep-learning models (e.g., OpenPose, MediaPipe) map key body landmarks in every frame.
- Temporal smoothing – Recurrent neural networks (RNNs) filter noise and isolate the release instant.
- Statistical variance – The AI calculates standard deviation across the last 20 deliveries, normalizing to produce the RCI.
Coaching actions
- Biomechanics feedback loops – Show bowlers a heatmap of release point dispersion and set incremental targets (e.g., improve RCI by 5 points each week).
- Drill adaptation – Introduce “anchor drills” that lock the non-dominant hand on a target to reinforce release consistency.
- Workload scheduling – Pair RCI trends with the Player Fatigue Predictive Score (see Section 5) to decide when a bowler needs rest or a technical session.
4. Fielding Reaction Time Tracker – Real-Time Movement Analytics for Catches and Stops
What it is
The Fielding Reaction Time Tracker (FRTT) measures the interval between ball contact and the first meaningful movement of a fielder (e.g., foot lift, arm extension). Using wearable IMUs and AI-enhanced video, the system logs reaction times to the millisecond.
Why it matters
- Reaction speed is one of the strongest predictors of successful catches and run-out chances (Source: A review of cricket fielding requirements).
- Identifies fielders who excel in specific zones (e.g., slip vs. deep mid-wicket) and those who need targeted drills.
- Correlates with fatigue; slower reaction times often precede performance dips.
How AI generates it
- Sensor fusion merges accelerometer data with visual tracking to pinpoint the exact moment of stimulus detection.
- Pattern recognition classifies movement types (short-run, dive, jump) and assigns a reaction latency.
- Benchmarking compares each fielder’s latency against elite baselines derived from international match footage.
Coaching actions
- Micro-drills – Implement “shadow-field” sessions where players react to projected ball trajectories, focusing on reducing latency by 10-15 ms each week.
- Position-specific training – Use the FRTT heatmap to allocate players to zones where their reaction profile is strongest.
- Recovery monitoring – Track reaction time trends post-match to gauge residual fatigue and schedule appropriate rest.
Tip: Re-test reaction times at the same point in each training week so that changes reflect genuine improvement rather than day-to-day fatigue.
5. Player Fatigue Predictive Score – Machine-Learning Model That Forecasts Fatigue Risk
What it is
The Fatigue Predictive Score (FPS) combines physiological data (heart-rate variability, sleep quality, cortisol levels) with workload metrics (balls bowled, runs scored, sprint distance) to forecast an athlete’s fatigue risk for the next 48 hours on a scale of 0–100.
Why it matters
- Fatigue is the silent killer of performance and a major injury catalyst.
- Predictive analytics in sports allow coaches to intervene before a decline manifests on the field.
- Enables smarter rotation policies, especially in congested tournament schedules.
How AI generates it
- Data ingestion – Wearable devices, GPS trackers, and self-reported wellness questionnaires feed into a centralized database.
- Feature engineering – AI extracts lagged variables (e.g., cumulative load over 7 days) and physiological trends.
- Predictive modeling – Gradient-boosted trees output a probability of “high fatigue” that is calibrated against historical performance drops.
Coaching actions
- Dynamic squad selection – Use FPS to decide which players to rest or rotate ahead of a crucial match.
- Recovery prescriptions – Pair high FPS with targeted recovery protocols (e.g., contrast baths, sleep hygiene workshops).
- Training periodization – Adjust net session intensity based on individual FPS trends, ensuring peak performance aligns with key fixtures.
Related article: Data-Driven Bowling Workload Management for Cricketers with AI shows how to embed load and fatigue monitoring into daily practice.
6. Skill Progression Heatmap – Visualizing Drill-Level Improvements Over Weeks
What it is
A Skill Progression Heatmap visualizes performance trajectories across multiple drills (e.g., net batting, bowling accuracy, fielding agility) over a defined period. Each cell’s color intensity reflects improvement magnitude, derived from AI-processed metrics such as exit velocity, release consistency, and reaction time.
Why it matters
- Provides a macro view of development, highlighting plateaus or rapid gains.
- Encourages data-driven conversation between coaches and players, moving beyond “feel-good” assessments.
- Helps allocate coaching resources where they yield the highest ROI.
How AI generates it
- Metric aggregation – AI consolidates daily drill data into weekly averages.
- Change detection – Time-series analysis flags statistically significant shifts (p < 0.05).
- Heatmap rendering – A lightweight front-end library (e.g., D3.js) displays the data in an intuitive, interactive format.
Coaching actions
- Individualized plans – Identify drills where a player’s heatmap shows stagnation and redesign the session (e.g., introduce variable-speed bowling machines).
- Goal setting – Set weekly targets based on the heatmap’s gradient, fostering a culture of continuous improvement.
- Team-level insights – Spot collective strengths or weaknesses (e.g., the entire squad struggles with direct-hit throwing) and schedule a focused camp.
7. Opposition Strategy Forecast – Predictive Analytics on Opponent Line-Ups and Tactics
What it is
The Opposition Strategy Forecast (OSF) uses historical match data, player form, and situational variables to predict the likely batting order, bowling changes, and field placements an opponent will employ in a given match.
Why it matters
- Gives coaches a strategic edge, allowing pre-emptive planning of bowling plans and field setups.
- Reduces uncertainty during the toss, informing the decision to bat or bowl first.
- Enhances mental preparedness; players arrive knowing the probable scenarios they’ll face.
How AI generates it
- Data mining – AI mines the past 3–5 years of ball-by-ball match data from sources like ESPNcricinfo and Cricsheet.
- Pattern recognition – Recurrent neural networks capture sequence patterns (e.g., how a captain rotates bowlers after a wicket).
- Scenario simulation – Monte-Carlo runs generate probability distributions for line-up configurations and tactical moves.
Coaching actions
- Pre-match briefing – Present the OSF to the squad, highlighting high-probability threats (e.g., a left-arm orthodox spinner in the death overs).
- Bowling plan customization – Align bowlers’ strengths with predicted opposition weaknesses (e.g., deploying a swing bowler against a right-handed top order).
- Field placement rehearsal – Rehearse the opposition’s likely field settings in net sessions, so batters instinctively know where the gaps will be.
Tip: Treat the forecast as a set of probabilities, not certainties—prepare a primary plan for the most likely scenario and a fallback for the next most likely.
8. Injury Probability Dashboard – AI-Based Early-Warning System for Common Cricket Injuries
What it is
The Injury Probability Dashboard aggregates biomechanical, physiological, and workload data to output a risk score for injuries such as lumbar stress fractures, rotator-cuff tears, and hamstring strains. The dashboard updates in real time, flagging players whose risk exceeds a predefined threshold.
Why it matters
- Early detection reduces time-loss injuries, preserving squad depth throughout a season. Research on elite fast bowlers found that sharp spikes in weekly workload were linked to higher injury risk the following week (Source: British Journal of Sports Medicine).
- Aligns with sports-science best practices for injury prevention, a focus of modern cricket academies.
- Enables transparent communication between medical staff, coaches, and athletes.
How AI generates it
- Feature synthesis – AI fuses video-derived kinematics (e.g., bowling front-foot impact angle) with wearable metrics (e.g., load spikes).
- Risk modeling – Survival analysis models estimate the probability of injury within the next 30 days.
- Alert system – Threshold breaches trigger automated notifications to the coaching and medical teams via the InstilPlay app.
Coaching actions
- Load adjustment – Reduce overs or modify training intensity for players with elevated risk scores.
- Targeted rehab – Deploy specific strengthening or mobility protocols (e.g., core stability for lumbar stress).
- Education sessions – Use the dashboard’s visualizations to teach athletes about self-monitoring and safe technique.
Related reading: Learn how managing bowling workloads keeps fast bowlers fit and firing in Master Bowling Workload Management: The Data-Driven Secret to Peak Performance.
Conclusion: Turning AI Metrics into Actionable Coaching Plans
The eight AI-driven metrics outlined above are more than data points—they are decision-making engines that empower you to coach with precision, predictability, and confidence. By integrating AI in sports analytics into your daily workflow, you can:
- Quantify impact – From ball-by-ball influence to fielding reaction speed, every action becomes measurable.
- Predict outcomes – Fatigue scores, injury probabilities, and opposition forecasts let you stay one step ahead of the competition.
- Personalize development – Skill progression heatmaps and consistency indices tailor training to each player’s unique trajectory.
Start by selecting the two metrics that address your most pressing challenges—perhaps the Ball-by-Ball Impact Score to sharpen match-day tactics and the Player Fatigue Predictive Score to safeguard wellbeing. Gradually layer in the remaining metrics, using InstilPlay’s integrated dashboard to visualize, track, and act on the insights in real time.
Ready to future-proof your coaching? Sign up for a free trial of InstilPlay’s AI-powered platform today, and transform raw data into winning performance. Your players deserve the edge—give it to them with science, technology, and a coach who leads with insight.